
Travel Trends
After a year of lockdowns, quarantines, and social distancing companies, and consumers alike have embraced online business like never before. According to Digital Commerce 360, U.S. eCommerce saw a 44% growth in 2020 and a current Longwoods International report shows that 87% of American travelers have travel plans in the next six months.
After a 45% decrease in total travel spending in 2020, the U.S. Travel Association predicts a return to pre-COVID numbers by 2024 and after the May 1 vaccine goal set by the current administration, over half of respondents in a Harris Poll survey say we will “return to normal” this summer. With the CDC recently lifting mask mandates, those 60% of respondents look to be in the right about our “normal” returning.
The increase in eCommerce and the return to normal for travel introduces more opportunity for an attack looking to increase its own footprint in the travel world.
The foundation of a Magecart attack is JavaScript: the language that makes web pages interactive. These attacks exploit JavaScript’s native access to a website to skim, insert, or change elements on that site. This is used to read payment information, add images or text fields, or change text, pictures, or links on the site to steal information and negatively impact the visitor experience.
The use of JavaScript since April 2020 has risen from 94.6% to 97.2%, according to W3Techs.com. As JavaScript usage increases and as new innovative ways to track, convert, and serve website visitors come to market, the risk of an attack grows as well.

Image 1 – Violations inside the Source Defense Platform
The Numbers
We took a look at 10 different travel sites to analyze their JavaScript usage and how it correlates to what we see on a daily basis. The sites are made up of two airlines, four resorts, two vacation rental companies, and two cruise lines.
Here is what we saw from these travel sites:
- 339 total scripts.
- 122 total unique scripts.
- 34 scripts per site – average.
Of those total scripts we found:
- 33 unique marketing services.
- 22 unique analytics services.
- 16 unique advertising services.
- 8 unique social media services.
When analyzing this data, we found:
- 180 million violations recorded by social media scripts.
- 94 million violations recorded by analytics scripts.
- 17 million violations recorded by advertising scripts.
- 4.7 million violations recorded by marketing scripts (measured using top 10 scripts over 14 days and 114.83 million page views).
It is important to note that violations do not mean attacks. Many of these violations, as we discussed in our Data Leakage Blog, relate to eavesdropping on data entered into fields. The eavesdropping is not malicious per se but can be in violation of data privacy regulations in some states.
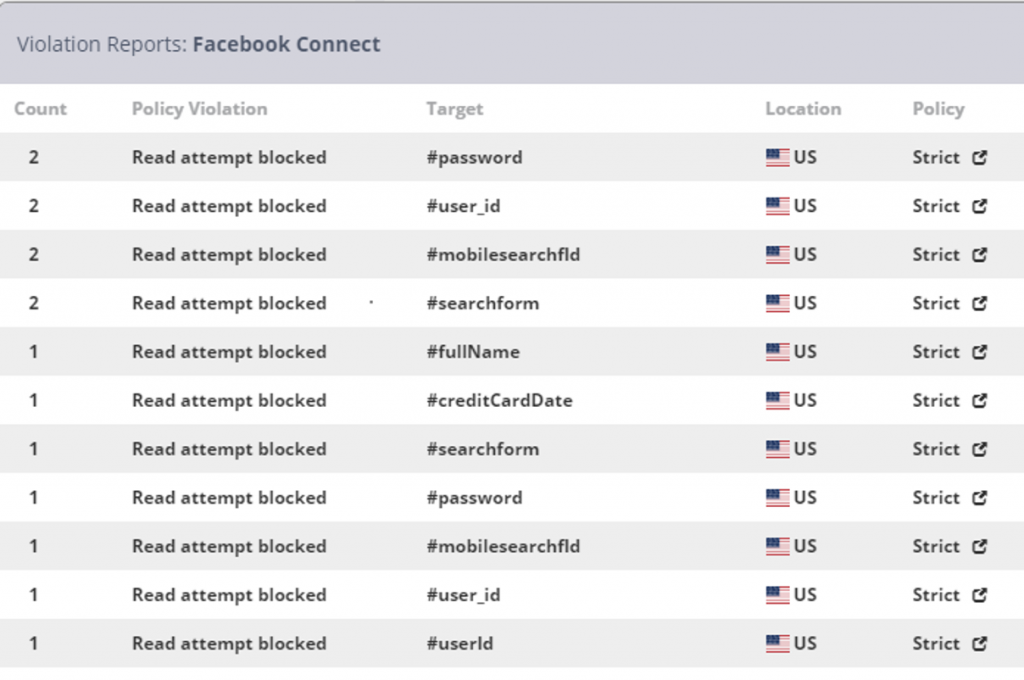
Image 2 – Social Media Read Violations as presented in the Admin Console
What is interesting about these numbers is the low volume of social media services being used compared to the high number of violations we see out of those same services. At around 1.5 violations per page view, social media services are still the biggest violator we see. These violation numbers conform to what is known about these companies. Social media companies function more like data warehouses than just a collection of wall posts and like buttons. Gathering that data, through legitimate means or through access not explicitly denied, is part of their identity.
If we contrast social media services with marketing services, 10% of scripts are made up of marketing services but we only see 1.3% of violations recorded come from marketing sources. The rampant data hoarding seen in social media companies is not present in many of the marketing services that we monitor.
The Takeaway
We have looked at how travel is on its way back to pre-pandemic numbers over the next couple of years, and how the usage of JavaScript is increasing even since mid-pandemic. We’ve also seen how certain travel sites and industries are using JavaScript to serve visitor and business needs alike. The violation trends seen here do not show any signs of slowing down, unless of course, your site or your preferred resort/airline/cruise line/vacation rental is using a solution specifically built to protect website data and their JavaScript usage from getting into the hands of the wrong people.
